In our previous post, we asserted that data offers the most value when it acts as a compass for an organisation.
The right measures can help align an organisation. The wrong measures create noise and lead to misalignments across an organisation. And sometimes, instead of measuring success metrics, we measure and reward performance based on team velocity and utilisation. This drives very different behaviours again.
So how do you arrive at the right data for your organisation? How do you develop the right measurements for alignment and performance? We flirted with mental models in our previous post and it’s handy again here. Bear with us – by the end of this post, we hope to have presented a different lens on your data organisation, one that helps you answer these questions and also gives you reason to revise how you view performance in your data organisation.
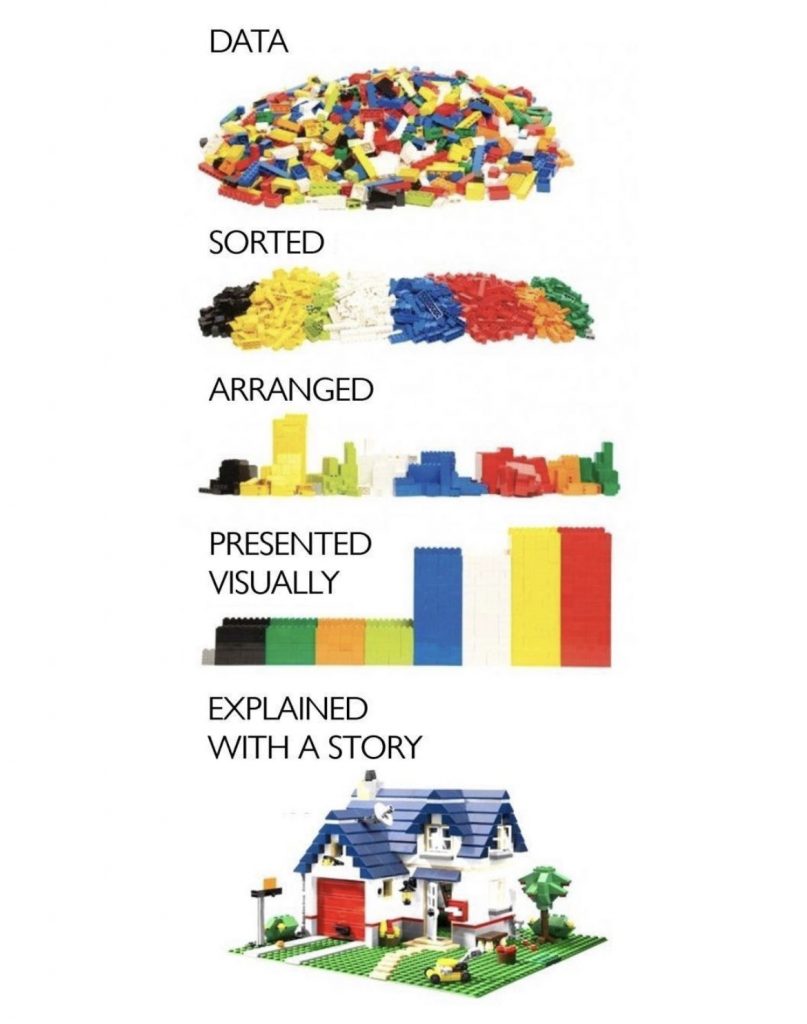
We referenced this lego analogy in our last post (widely credited to djgeoffe). It hints at the ETL process common to most data projects, the journey to ‘value’ and among other things, some of the disciplines for mastery. For example:
- The art of organising data for ease of access
- The business insights that provide an understanding of the data inventory (3 black bricks, 3 green bricks, 11 red bricks, and so on)
- The knowledge necessary to create the final product
There are of course limitations to this analogy (which in no way diminishes its merits). For example,
- How do you uncover the knowledge for the final build pattern – how do you, in effect, go from stacks of bricks to the lego house
- Are the instructions to get there a business or technology discipline
- How would you maintain ease of access when the data to be organised has more attributes (than just colour and shape)
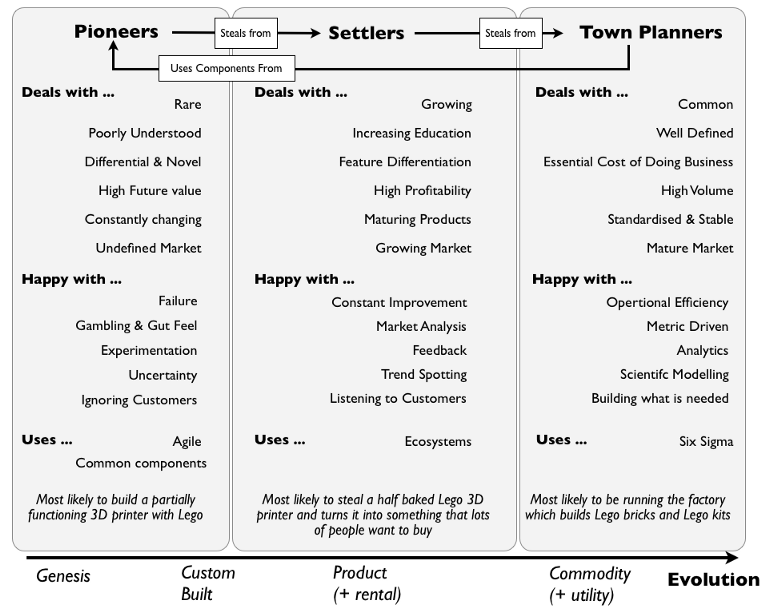
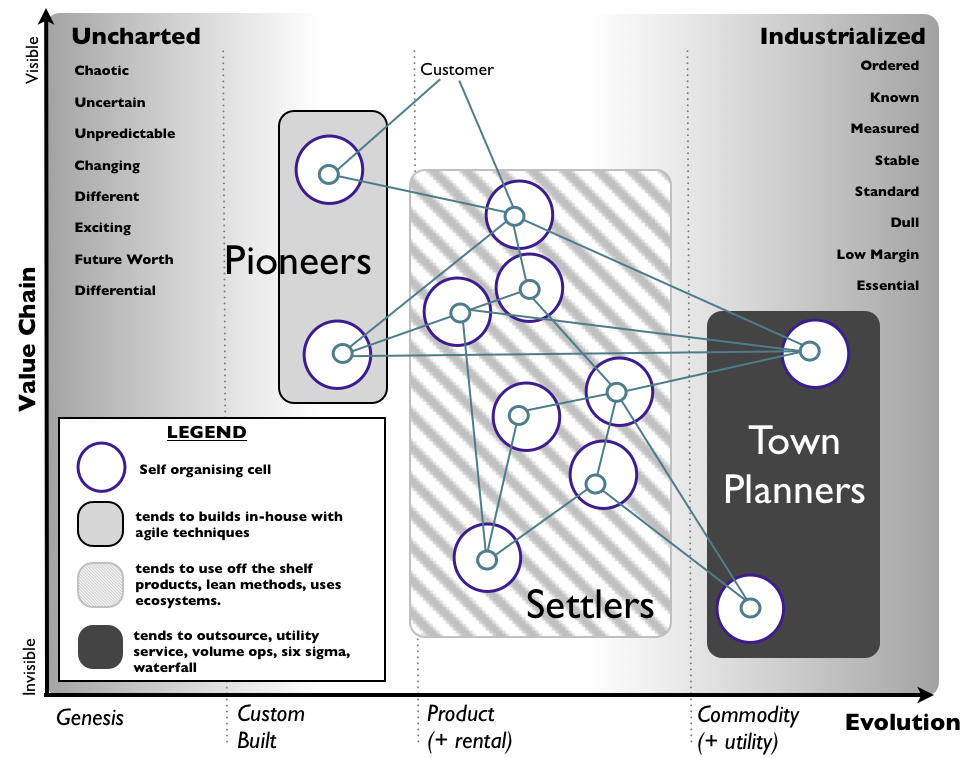
Let’s take a different lens, through a Pioneers, Settlers and Town Planners analogy. This analogy reimagines Data in the context of an evolving settlement.2
Pioneers: One of the perennial challenges in data is the amount of time it takes to curate data. Sourcing and understanding data sufficiently to stitch together a meaningful narrative can take an inordinate amount of time. Data science use cases estimate this to be around 80% of the effort. It’s hard! The more novel the data, the greater the wild, wild, west effort. Pioneers have to do whatever it takes to source the data, understand it, and get to the truest of MVP’s (just enough code to demonstrate the value, and it can feel like quite a heroic effort to get there!).
Settlers: Settlers evolve the work that Pioneers have begun. They create a pathway from MVP to commoditisation.
- They take cues from Pioneers and develop self service capabilities such as near-ready data assets, on demand prototyping environments, tooling for data mining, analytics and prototyping of data products.
- They organise data1 and provide services that make it easy to not just locate and access the right data, but to also easily interpret it relative to business processes and the organisation’s products, customers, vendors, suppliers, services and activities. These become organisational assets that help build trust and understanding.
I have a soft spot for settlers – they’re the glue in Data environments, seeking to understand pioneers and improve lived experiences within and with the settlement. They understand the settlement intimately and help town planners to see the opportunities for commoditisation.
Town Planners: Settler services that are in high demand, but take a long time or are costly to provision represent the sweet spot for commoditisation. Town planners can help to industrialise and commodotise these services:
- Introduce data ingestion and sharing mechanisms that make it cheaper and faster to ingest and access new data sources
- Introduce data management applications that automate processes around reference data management, data quality and knowledge management
- Automate monitoring and maintenance activities
- Automate testing and deployment activities
- Introduce on-demand cloud compute and storage
- Introduce on-demand data tooling that simplifies access to interpreters and software libraries
- and more.. devOps, dataOps, mlOps are industrialisation methods for Town Planners.
SO WHAT
This analogy hints at how Data projects can be agilist in principle, evolved and scaled.
- It recognises the necessary functions and very human aspect to building robust solutions. You’ll need to identify and help these 3 functions (Pioneers, Settlers, Town Planners) work together in your data organisation. Not everyone is cut out to be a Pioneer, some are better suited as Town Planners, others as Settlers.
- It hints at information flow across the three functions
- Pioneers inform Settlers, Settlers inform Town Planners: this directional flow of information is how you uncover what products to build, and the knowledge that underpins the build pattern for those products (or in the case of our lego analogy, the instructions that take you from stacks of bricks to a lego house).
- There’s a virtuous flow of benefits back – Settlers enable Pioneers, Town Planners enable Settlers. This is how you make the product more robust and deliver faster.
- The circular flow of information and benefits helps your data organisation solve the right problem, solve it well, and produce an end result that is accessible and has mass appeal.
- The process of evolution (to move ideas from a prototype, to a final product that has mass market appeal) is more effective with these 3 functions or actors within the system. As Drew Firment shares (here): “..settlers.. perform an essential function in ensuring that work is taken from the pioneers and turned into mature products before the town planners can turn this into industrialized commodities or utility services. Without this middle component then yes you cover the two extremes (e.g. agile vs six sigma) but new things built never progress or evolve. You have nothing managing the ‘flow’ from one extreme to another.”
- It also communicates the need to focus your scaling (industrialisation) efforts.
- And finally, with at least 3 different functions, with 3 different purposes, there are then at least 3 different ways to view performance for each function.
By creating this virtuous cycle which is incentivised so that each group steals the work of the former – town planners stealing from settlers who steal from pioneers who build on the work of town planners – you can accelerate innovation, customer focus and efficiency all at the same time and remove the threat of inertia to change.
Simon Wardley
Food for Thought
- Do you know the pioneers in your data organisation
- Are they well connected to your town planners and settlers
- How is collaboration encouraged across these 3 groups
- What’s slowing down or enabling your pioneers
- Are your regulations stopping your pioneers from doing their work
- How might you manage regulatory requirements and security risks, while still enabling your pioneers
- Are you commoditising rarely used features – how would you know
- How well are your settlers establishing the settlement for Pioneers and Town Planners
- Are your settlers identifying common patterns in the ecosystem
- Are your settlers empowered to ‘steal’ established patterns from other settlements
- Are they retiring old, unused services
- In light of this mental model, how would you measure, monitor and encourage performance for your data group or data project
And what does this have to do with spreadsheets?
Have you ever been so creatively clever (at short notice, under time pressures) and delivered something for a stakeholder you value (who just needed something done quickly), knowing (or perhaps not knowing) you were breaking good architecture rules?
Welcome, truly, Pioneer.
footnotes
1 I’ve often found the organisation of data to be the hardest to explain. Yet, it significantly affects the lived experience of pioneers, settlers and town planners. Underestimating the complexity and having a blind spot to it will lead to project blowouts. While I don’t yet have a mental model that does this aspect justice, I can recommend the following book. This book is relevant to pioneers, settlers, town planners alike. It doesn’t belabour the nitty gritty of organising data but provides enough of a bird’s eye view (and swoops down into detail enough to give you a reassuring feel of the ground) to explain data principles that additively help you understand techniques for organising your data (so that it’s agile and it has potential to scale!).
The Nimble Elephant: Agile Delivery of Data Models using a Pattern-based Approach
(not a paid recommendation)
2 The Pioneers, Settlers and Town Planners analogy is in fact a business strategy tool in the form of a Wardley map. It’s depicted as follows by Simon Wardley in his blog post:
Also expanded upon very informatively by Drew Firment in the context of Cloud Adoption in this blog post – I find his profiling of Pioneers, Settlers and Town Planners quite relatable to Data: